In our previous blog post we had discussed about What is Reports in Salesforce. In these blog post we discuss about What is Dashboards in Salesforce
Contents
- 1 Introduction
- 1.1 Understanding Salesforce Dashboards
- 1.2 Definition of Dashboards
- 1.3 Purpose and Benefits
- 1.4 Creating a Dashboard in Salesforce
- 1.5 Step-by-Step Guide
- 1.6 Key Components of Salesforce Dashboards
- 1.7 Dashboard Components
- 1.8 Data Sources
- 1.9 Types of Dashboards in Salesforce
- 1.10 Operational Dashboards
- 1.11 Analytical Dashboards
- 1.12 Strategic Dashboards
- 1.13 Tips for Effective Dashboard Design
- 1.14 Customizing Dashboards
- 1.15 Layout and Design Options
- 1.16 Using Filters in Dashboards
- 1.17 Importance of Filters
- 1.18 How to Apply Filters
- 1.19 Sharing Dashboards
- 1.20 Sharing Settings
- 1.21 Best Practices for Collaboration
- 1.22 Real-Time Data and Dashboards
- 1.23 Importance of Real-Time Data
- 1.24 Integrating Real-Time Data into Dashboards
- 1.25 Mobile Access to Dashboards
- 1.26 Salesforce Mobile App
- 1.27 Viewing and Interacting with Dashboards on Mobile
- 1.28 Common Use Cases for Dashboards
- 1.29 Sales Performance Tracking
- 1.30 Customer Service Metrics
- 1.31 Marketing Campaign Analysis
- 1.32 Best Practices for Dashboard Maintenance
- 1.33 Security and Permissions
- 1.34 Dashboard Access Controls
- 1.35 Managing Permissions
- 1.36 Limitations of Salesforce Dashboards
- 1.37 Overcoming Limitations
- 1.38 Conclusion
- 1.39 FAQs
What is Dashboards in Salesforce
Introduction
Salesforce is a powerful Customer Relationship Management (CRM) platform that helps businesses manage their relationships and interactions with customers. Among its many features, Salesforce dashboards stand out as a vital tool for visualizing data and making informed decisions. But what exactly are dashboards in Salesforce, and why are they so important.
Understanding Salesforce Dashboards
Definition of Dashboards
In Salesforce, a dashboard is a visual representation of data from multiple reports, allowing users to quickly gain insights and make data-driven decisions. Think of it as a control panel for your business data, where you can see key metrics and trends at a glance.
Purpose and Benefits
The primary purpose of dashboards is to consolidate data from various sources into one coherent view. This enables users to monitor performance, identify trends, and detect issues without sifting through numerous reports. The benefits are manifold: improved decision-making, enhanced efficiency, and better alignment with business goals.
Creating a Dashboard in Salesforce
Step-by-Step Guide
Creating a dashboard in Salesforce involves several steps:
- Define Your Goals: Understand what you want to achieve with the dashboard.
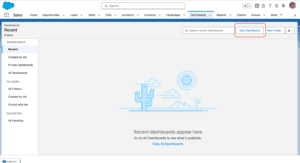
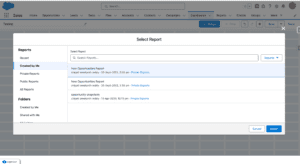
- Create Reports: Build the necessary reports that will feed data into your dashboard.
- Choose a Dashboard Type: Decide whether you need an operational, analytical, or strategic dashboard.
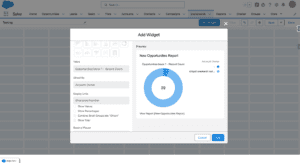
- Add Components: Select the components that will best represent your data.
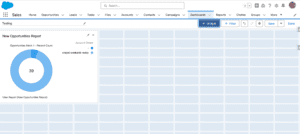
- Arrange Layout: Organize the components in a way that makes the dashboard easy to read.
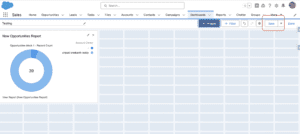
-

What is Dashboards in Salesforce Save Save and Share: Save your dashboard and configure sharing settings.
Key Components of Salesforce Dashboards
Dashboard Components
Dashboards in Salesforce are made up of several components, including charts, tables, gauges, and metrics. Each component displays data in a specific format, making it easier to interpret and act upon.
Data Sources
Dashboards pull data from Salesforce reports. These reports can be created using different data sources such as objects, fields, and filters. The flexibility in data sourcing allows for comprehensive and customizable dashboards.
Types of Dashboards in Salesforce
Operational Dashboards
Operational dashboards focus on real-time data and are used for monitoring day-to-day operations. They help track activities, workloads, and immediate performance metrics.
Analytical Dashboards
Analytical dashboards delve into historical data to identify trends and patterns. These are useful for strategic planning and long-term analysis.
Strategic Dashboards
Strategic dashboards provide a high-level view of key performance indicators that align with the organization strategic goals. They are often used by senior management to track progress towards objectives.
Tips for Effective Dashboard Design
- Keep It Simple: Avoid clutter by focusing on the most important metrics.
- Use Visuals Wisely: Choose the right type of charts and graphs to represent your data.
- Ensure Accuracy: Double-check your data sources and calculations.
- Make It Interactive: Use filters and dynamic components to allow users to drill down into data.
Customizing Dashboards
Salesforce dashboards are highly customizable. You can adjust the size, position, and type of components to fit your needs. Customizable headers and footers can also be added to provide additional context.
Layout and Design Options
Salesforce offers a range of layout and design options. You can choose from various templates or create your own layout. This flexibility ensures that your dashboard meets your specific requirements.
Using Filters in Dashboards
Importance of Filters
Filters are essential for refining the data displayed on your dashboard. They allow users to focus on specific subsets of data, such as a particular time period or geographic region.
How to Apply Filters
Applying filters in Salesforce dashboards is straightforward. You can add filters while creating the dashboard or modify them later. Filters can be based on fields from the underlying reports or custom criteria.
Sharing Dashboards
Sharing Settings
Salesforce provides robust sharing settings to control who can view or edit your dashboards. You can share dashboards with individual users, roles, or public groups.
Best Practices for Collaboration
For effective collaboration, ensure that the right people have access to your dashboards. Regularly review sharing settings to maintain security and relevance.
Real-Time Data and Dashboards
Importance of Real-Time Data
Real-time data is crucial for making timely decisions. Dashboards that incorporate real-time data provide up-to-the-minute insights, enabling swift responses to changing conditions.
Integrating Real-Time Data into Dashboards
To integrate real-time data into your dashboards, use live data sources and configure your reports to refresh at appropriate intervals. This ensures that your dashboards always display the most current information.
Mobile Access to Dashboards
Salesforce Mobile App
The Salesforce Mobile App allows users to access dashboards on the go. This mobile access ensures that you can stay informed and make decisions even when away from your desk.
Viewing and Interacting with Dashboards on Mobile
Dashboards on the mobile app are interactive, allowing you to apply filters and view detailed data just like on the desktop version. This flexibility is particularly useful for sales teams and executives who travel frequently.
Common Use Cases for Dashboards
Sales Performance Tracking
Dashboards are invaluable for tracking sales performance. They can show metrics like sales targets, pipeline status, and win rates, helping sales teams stay on track.
Customer Service Metrics
Customer service dashboards can display metrics such as response times, resolution rates, and customer satisfaction scores. This helps service teams improve their performance and customer experience.
Marketing Campaign Analysis
Marketing teams use dashboards to analyze the effectiveness of campaigns. Metrics like lead generation, conversion rates, and ROI can be tracked to optimize marketing efforts.
Best Practices for Dashboard Maintenance
Regular Updates
Regularly updating your dashboards ensures they remain relevant and accurate. Schedule periodic reviews to incorporate new data sources and adjust components as needed.
Performance Optimization
Optimizing dashboard performance involves streamlining data sources, reducing the number of components, and ensuring efficient data queries. This improves load times and user experience.
Security and Permissions
Dashboard Access Controls
Controlling access to dashboards is crucial for data security. Salesforce provides detailed permissions settings to manage who can view or edit your dashboards.
Managing Permissions
Regularly review and update permissions to ensure that only authorized users have access to sensitive data. Use roles and profiles to simplify permission management.
Limitations of Salesforce Dashboards
Common Challenges
Despite their many advantages, Salesforce dashboards have limitations. These can include performance issues with large data sets, complexity in setting up advanced features, and restrictions on customization.
Overcoming Limitations
Overcoming these limitations involves careful planning and leveraging Salesforce’s extensive resources and community. For complex needs, consider using third-party tools that integrate with Salesforce.
Conclusion
Salesforce dashboards are a powerful tool for visualizing and analyzing data. By understanding their components, types, and best practices for creation and maintenance, you can leverage dashboards to enhance your decision-making processes. Whether you’re tracking sales performance, customer service metrics, or marketing campaign effectiveness, Salesforce dashboards provide the insights you need to drive success.
We Want to More About What is Dashboards in Salesforce Click HERE
FAQs
What is the difference between a report and a dashboard in Salesforce?
A report in Salesforce is a detailed table of data, while a dashboard is a visual representation of data from multiple reports. Dashboards offer a more intuitive and consolidated view.
How often should dashboards be updated?
Dashboards should be updated as often as your business needs change. Regular reviews, at least quarterly, help ensure that the data remains relevant and accurate.
In our next blog post we will discuss about What is a Dynamic Dashboard in Salesforce

3 thoughts on “What is Dashboards in Salesforce”