In our previous blog post we had discussed about What are Mail Merge Templates in Salesforce.In these blog post we discuss about What is Reports in Salesforce
Contents
What is Reports in Salesforce
Salesforce is a powerful tool that helps businesses manage their customer relationships and streamline their operations. One of the key features that makes Salesforce so effective is its robust reporting capabilities. But what exactly are reports in Salesforce, and why are they so crucial to business success? Let’s dive in and find out.
Understanding Salesforce Reports
Salesforce reports are detailed, customizable views of your data, designed to help you analyze and interpret the information stored in your Salesforce environment. They allow you to track progress, identify trends, and make data-driven decisions.
Creating a Report
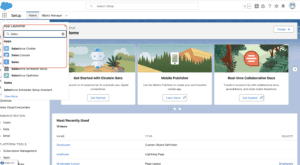
Creating a report in Salesforce is straightforward:
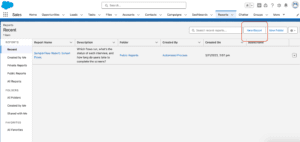
- Navigate to the Reports tab.

- Click “New Report.”

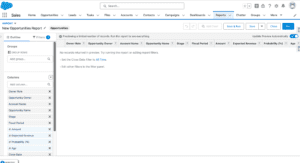
- Select the report type.
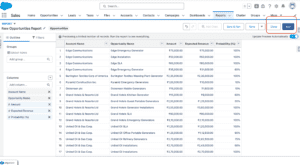
Choose your fields and filters.

- Run the report to see your data in action.

Understanding Reports in Salesforce
Definition of Reports
Reports in Salesforce are your go-to tools for compiling data from your Salesforce environment and presenting it in a structured format. Think of them as custom views into your data, tailored to answer specific questions or track key metrics.
Types of Reports
Tabular Reports
The simplest type, tabular reports display data in rows, similar to a spreadsheet. They’re great for lists but lack grouping or summarization capabilities.
Summary Reports
Summary reports allow you to group rows of data, providing subtotals and enabling deeper insights. These are ideal for generating financial statements or sales pipelines.
Matrix Reports
Matrix reports offer both row and column groupings, giving a multi-dimensional view of your data. This format is perfect for comparing related totals, such as sales by region and product.
Joined Reports
Joined reports let you create multiple report blocks within a single report. This feature is useful for comparing different data sets side by side.
Customizing Reports
Customization is where Salesforce reports truly shine. Here’s how you can make your reports even more insightful:
- Adding Filters: Narrow down the data displayed in your report by adding filters based on specific criteria.
- Grouping Data: Organize your data by grouping it based on fields such as date, region, or sales rep.
- Adding Formulas and Calculated Fields: Enhance your reports by adding custom formulas and calculated fields to perform complex calculations.
Advanced Reporting Features
Salesforce offers several advanced features to take your reporting to the next level:
- Cross Filters: These allow you to filter your reports based on related objects.
- Conditional Highlighting: Highlight data based on conditions to make important information stand out.
- Bucketing Fields: Group related data into categories without creating a formula or a custom field.
Scheduling and Automating Reports
One of the biggest advantages of Salesforce reports is their automation capabilities:
- Setting Up Report Schedules: Schedule your reports to run at regular intervals and be delivered to your inbox.
- Emailing Reports: Share your insights by emailing reports directly from Salesforce.
- Automating Report Distribution: Use Salesforce’s automation tools to distribute reports to stakeholders automatically.
Dashboards and Reports
Dashboards provide a visual representation of your reports, making it easier to interpret data at a glance:
- Relationship Between Dashboards and Reports: Dashboards are built using underlying reports.
- Creating Dashboards from Reports: Select the reports you want to include and configure the dashboard components to display the data visually.
- Customizing Dashboard Components: Tailor your dashboard by customizing components to highlight the most important data.
Best Practices for Salesforce Reporting
To get the most out of Salesforce reports, follow these best practices:
- Ensuring Data Accuracy: Regularly clean and update your data to ensure your reports are accurate.
- Optimizing Report Performance: Use filters and limit the number of fields to improve report performance.
- Keeping Reports Organized: Organize your reports into folders and use consistent naming conventions.
Common Use Cases of Salesforce Reports
Salesforce reports can be used for various purposes:
- Sales Performance Analysis: Track sales metrics and identify top-performing sales reps.
- Customer Service Tracking: Monitor customer service metrics such as response times and resolution rates.
- Marketing Campaign Performance: Analyze the effectiveness of marketing campaigns and measure ROI.
Challenges and Solutions in Salesforce Reporting
Despite their power, Salesforce reports can pose some challenges:
- Handling Large Datasets: Use report filters and summary fields to manage large datasets effectively.
- Dealing with Data Privacy Concerns: Implement proper security measures to protect sensitive data.
- Ensuring User Adoption: Provide training and support to ensure users are comfortable with creating and using reports.
Tips for Effective Report Design
Designing effective reports involves more than just pulling data:
- Clarity and Simplicity: Keep your reports clear and easy to understand.
- Visual Appeal: Use charts and graphs to make data more digestible.
- Relevance to Business Goals: Focus on data that is relevant to your business objectives.
Integrating Salesforce Reports with Other Tools
Extend the power of Salesforce reports by integrating them with other tools:
- Exporting Reports: Export your reports to various formats like Excel or PDF for further analysis.
- Using Third-Party Analytics Tools: Integrate Salesforce with third-party tools like Tableau or Power BI for more advanced analytics.
Security and Sharing of Reports
Ensure your reports are secure and accessible:
- Setting Report Visibility: Control who can view and edit your reports by setting visibility options.
- Sharing Reports with Team Members: Share reports with specific users or groups within your organization.
Future Trends in Salesforce Reporting
The future of Salesforce reporting looks exciting with several trends on the horizon:
- AI and Machine Learning Integration: Expect more AI-driven insights and predictive analytics.
- Enhanced Data Visualization Techniques: Look forward to more advanced and interactive data visualization options.
Conclusion
Salesforce reports are a powerful tool for any business, providing deep insights into your data and helping you make informed decisions. By understanding how to create, customize, and utilize these reports, you can unlock their full potential and drive your business forward.
We want more about What is Reports in Salesforce Click Here
FAQs
- What are the different types of reports in Salesforce?
- Salesforce offers Tabular, Summary, Matrix, and Joined reports, each serving different data analysis needs.
- How can I customize a report in Salesforce?
- You can customize reports by adding filters, grouping data, and incorporating formulas and calculated fields.
- Can I automate the distribution of Salesforce reports?
- Yes, Salesforce allows you to schedule reports and automate their distribution via email.
- What are some best practices for creating Salesforce reports?
- Ensure data accuracy, optimize report performance, and keep reports organized with clear naming conventions and folders.
- How can Salesforce reports improve my business operations?
- Salesforce reports provide insights that help in tracking performance, identifying trends, and making data-driven decisions, thereby improving overall business operations.
In our next blog post we will discuss about What is Dashboards in Salesforce

3 thoughts on “What is Reports in Salesforce”